|
Hornsby Shire Council
|
Attachment to Report No. EN38/08 Page 0
|
The Catchments Remediation
Rate Capital Works Program
Annual Performance Report
2007/2008
Prepared by the Water
Catchments Team
September 2008
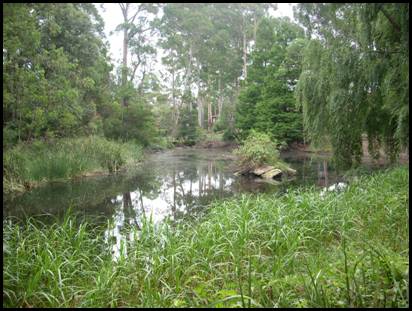
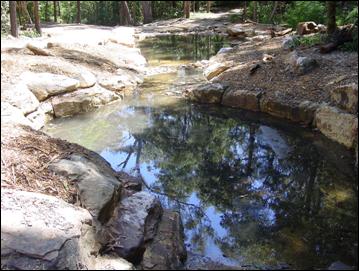
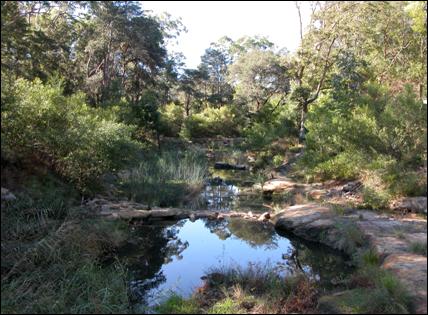
Cherrybrook Lakes, Cherrybrook (Water Quality
sampling site)
The 2007/2008 Catchments Remediation Rate Capital
Works Annual Performance Report was prepared by Elizabeth Bulley and David Beharrell of the Water Catchments Team,
Environment Division, Hornsby Shire Council. The report was prepared under the
supervision of Ross McPherson, Manager, Water Catchments, and under the
direction of Robert Stephens, Executive Manager, Environment Division.
For further information contact:
Water Catchments Team
Hornsby Shire Council
PO Box 37
Hornsby
NSW 1630
Phone: (02) 9847
6860
Fax: (02) 9847
6598
Email: dbeharrell@hornsby.nsw.gov.au
This report aims to provide quantitative data and
analysis of the relative performance of different water quality treatment
measures, including gross pollutant devices, sediment basins, wetlands and
bioremediation systems that have been constructed to improve stormwater quality
in Hornsby Shire. The results of the report will be used by stormwater and
catchment managers to provide a better insight into determining the type of
structures that are suitable for specific sites. Furthermore, the data provides
valuable information about the costs (both capital and maintenance), benefits
and device optimisation which can aid in the formulation of strategies to
improve catchment/landuse practices by both structural and non-structural
means.
The principal objective of installing stormwater
treatment measures is to improve the quality of stormwater by removing
pollutants and in some instances retaining stormwater flows. In 2007/08, 16
catchments remediation capital works projects were completed at a total cost of
$957,000. These works involved the construction and/or installation of 11
sediment basins, four end-of-pipe gross pollutant traps, eight stream
remediation projects, one bioremediation basin and six stormwater gardens.
While these structural interventions provide
treatment of pollutants, the Catchments Remediation Program also promotes and
funds non-structural initiatives in the pursuit of improving stormwater quality.
These include: monitoring, maintenance, ensuring stormwater controls on new
development sites, street sweeping, environmental education, business auditing,
compliance programs and pollution clean-ups.
The
collection of performance data over the 2007/2008 financial year has allowed
Council to examine the indicative maintenance costs and gross pollutant
(sediment, litter and organic matter) removal from Council’s 370 + water
quality improvement devices. The results show that 1236 cubic metres of sediment, litter and organic matter was removed
from the Shire’s drainage system and waterways over an average 13 separate
cleaning events.
The total
cost to Council to maintain its water quality assets and adjacent landscaped
areas was $354,000. This cost included device inspections, cleaning and
desilting, material processing for reuse, disposal of litter to landfill, asset
maintenance and repair, landscape maintenance and weed control in and around
assets and maintenance of leachate treatment and reuse facilities. The annual maintenance cost was more than
previous years which can be attributed to two large maintenance projects: 1)
the remediation of the Mt Colah stockpiling site ($87,000), and 2) Dredging the
Lakes of Cherrybrook ($45,000), and the increased cost incurred by having to send
recovered material to landfill.
The report
also provides information on costs, sizing and performance of wetland ponds
constructed under the Catchments Remediation Program. In addition, Council has
embarked on a program to remediate degraded creeks and former landfill sites
and trial new and innovative stormwater infiltration, reuse and bioremediation
systems. Of particular interest in the
2007/2008 period were the bioremediation basin and stormwater gardens
constructed at Cheltenham and Berowra.
Overall, the findings of this report give stormwater
managers a better insight into the cost-effectiveness and performance of water
quality improvement structures and the management of life-cycle costs for
individual stormwater quality assets. The performance of these devices allows
Council to both refine and modify the design of future water quality control
measures, and judge their appropriateness for proposed remediation sites based
on catchment size and land use impact.
|
Hornsby Shire Council
|
Attachment to Report No. EN38/08 Page 3
|
TABLE OF CONTENTS
EXECUTIVE
SUMMARY. 3
1.0 INTRODUCTION. 5
1.1 Report Objective. 5
1.2 Background. 5
1.2.1
Catchments Remediation Program.. 5
1.2.2
Catchments Remediation Rate (CRR) and Panel 6
1.3
Statutory Considerations. 7
2.0 Selection
and implementation of the CRR Capital Works. 9
2.1 Selecting
a stormwater treatment measure. 9
2.2 Project
Management and Construction. 9
2.3
Maintenance Considerations. 9
2.4 Maintenance
Operations. 10
2.5 Occupational
Health and Safety (OH&S) and Risk Management. 11
3.0 Stormwater Treatment
Measures. 12
3.1 Gross
Pollutant Devices (GPD’s) 12
3.1.1. Trash Racks (21) 12
3.1.2. Litter Baskets (10) 14
3.2 Gross
Pollutant Devices - Proprietary (247) 14
3.2.1. Net Techs/Pratten
Nets/Channel Nets (44) 14
3.2.2. Underground Vaults
(20) 15
3.2.3. Ski-Jump Litter Traps
(4) 15
3.2.4. Pit Inserts (170) 15
3.3 Constructed
Wetlands. 16
3.4 Sediment
Basins. 17
3.5 Stream
Remediation. 17
3.6 Bioremediation
Basin - Castle Howard Road, Cheltenham.. 20
3.7 Stormwater
Gardens - Turner Road, Berowra. 21
3.8 Developer
Constructed Devices. 22
4.0
PERFORMANCE EVALUATION AND COSTS. 23
4.1 Rainfall measurement. 23
4.2 Performance
of Gross Pollutant Devices. 23
4.2.1 Pollutant Removal Trends. 23
4.2.2 Maintenance Costs. 26
4.2.3 Dredging Lakes of
Cherrybrook. 26
4.3 Wetland
Performance. 27
4.3.1
Pollutant Removal Trends and Costs. 27
4.4 Material
Disposal and Reuse. 28
5.0 LANDSCAPE
MAINTENANCE AND BUSH REGENERATION. 30
5.1 General
Maintenance Considerations. 30
5.2 Maintenance
of Landscapes surrounding Gross Pollutant Devices. 30
5.3 Maintenance
of Wetlands. 30
6.0 LANDFILL
REMEDIATION. 32
6.1 Foxglove
Oval, Mount Colah. 32
6.2 Arcadia
Park, Arcadia. 33
7.0 STREET SWEEPING.. 34
8.0 CONCLUSIONS. 35
9.0 REFERENCES. 36
Appendix
A: Rainfall data for Hornsby LGA. 37
Hornsby is located 25 kilometres north-west of the
Sydney CBD and is the Council base for a Shire covering approximately 50,990
hectares and serving the needs of more than 157,000 residents. The Shire
extends from Epping in the south to Brooklyn and Wisemans Ferry in the north
fronting a large expanse of the Lower
Hawkesbury River.
A majority of the northern and central Shire consists of Regional and National
Park and Nature Reserve. This unique natural character combined with the many
creeks and estuaries has led to Council being termed the ‘Bushland Shire’.
In an attempt to conserve the ecological value of the
Shire’s many natural waterways and to improve the quality of urban stormwater
Hornsby Shire Council has taken an integrated approach to stormwater quality
management by developing a range of capital and non-capital (preventative)
measures. This initiative includes all major catchments under the Stormwater
Management Plan framework, together with more closely modelled sub-catchment
plans. Council’s progressive strategy has recognised the need to tackle these
challenges using a broad approach to understanding and managing the total water
cycle. This has led to the development
of a Sustainable Total Water Cycle Management Strategy (2005).
This report focuses on the performance of different
stormwater quality control structures e.g. gross pollutant devices, constructed
wetlands, sediment basins, stream remediation and leachate treatment works that
have been constructed under Council’s Catchments Remediation Rate (CRR) Capital
Works Program.
To provide quantitative data and an analysis of the
relative performance of different stormwater and leachate quality improvement
devices that have been implemented under the CRR program. Specific reference
will be made to those devices constructed and/or installed in the 2007/2008
financial year.
In response to
general water quality degradation, including red algal blooms and fish kills in
the Berowra Creek estuary in September 1993, Hornsby Council placed a
moratorium on all development assessments within the catchments of the West
Hornsby STP. To resolve this, the
Minister for Planning established a Technical Working Party (TWP), comprising
representatives of Council, the Water
Board (Sydney Water) and the Department of Urban Affairs and Planning
(DUAP). Representatives from the
Environment Protection Authority (EPA) and the Hawkesbury-Nepean Catchment
Management Trust joined the TWP in early 1994.
The TWP confirmed that the two Sewage Treatment Plants (STP’s) contributed
to the poor water quality of the creek.
Moreover, it highlighted the significant role of polluted urban
stormwater, particularly runoff from developing and newly developed residential
areas.
On 27 April 1994, the
participating organisations of the TWP signed a Statement of Joint Intent (SoJI
- also known as the Community Contract for Berowra Creek) agreeing to work
together to achieve the ecologically sustainable development (ESD) of the
Berowra Creek catchment and the recovery of the environmental health of the
creek. The Community Contract, included
agreements to upgrade the STP’s and it bound the parties to the preparation and
implementation of a Water Quality Management Strategy. It also required Council to prepare and
implement a strategy to reduce stormwater nutrient ingress to Berowra Creek and
to utilise water sensitive design in its consideration of future developments.
However, the level of pollutants and the urgent need
for action was not confined to Berowra Creek. Water quality in the other major
catchments within the Shire had also deteriorated because of urbanisation.
Remedial works to reduce pollution and improve water quality were required
throughout the entire Shire including relevant areas draining the Cowan Creek, Lane Cove River and the Hawkesbury River
catchments.
In 1995, the Water Catchments Team initiated the first
phase of the ongoing strategic planning for catchment management within the
Shire. The result was the production of a Catchments Remediation Program
Five-Year Plan which detailed the proposed expenditure of the Catchments
Remediation Rate towards meeting the objectives of the Statement of Joint
Intent and in turn improving water quality in the Shire’s waterways. The Plan
included financial forecasts of rate income over a five year period together
with capital investment and non-capital expenditure including asset management.
It was hoped that Hornsby Shire Council’s Catchments
Remediation Program would give stormwater managers a better insight into the
cost-efficiency and performance of individual devices, but more importantly,
monitoring of devices will reflect the individual characteristics of
sub-catchments and the associated point sources of pollution, which can be
targeted through pollutant minimisation strategies. It was also seen that
community and industry awareness projects are important to complement the
Catchments Remediation Program, whilst Local Government can also review work practices
and strategies in relation to sediment and erosion controls on building sites
(and there enforcement), street sweeping, street tree planting, rubbish
collections and kerbside recycling collections.
Additional objectives of the
Catchments Remediation Program, which still apply today, aim to address:
· Innovation – products and services – generate and use
ideas to add value to the community as stakeholders, provide productivity
improvements, continue leadership and management capabilities in local government
· Health and safety – provide a safe and healthy aquatic
environment for the community, council staff and contractors
· Performance – better understand community needs and
expectations, ensure/deliver reliability, durability, quality and maximise the cost/benefit
of installed capital projects
· Justify expenditure
through regular reports to the community, protect and service assets and
continually improve operations.
Council’s catchments remediation work up to 1997 was
only partly funded by the CRR, with the majority of funding being at the
expense of other traditional Council services e.g. Parks. However, the cost of
Council’s ‘Statement of Joint Intent (SoJI) for Berowra Creek’ obligations and
remediation works in the other catchments was highlighted to be much more than
was covered by the rate. The proposal to increase the CRR from 2% to a 5% levy
on ordinary rates in 1997 was presented with the idea to accelerate remediation
capital works and return resources to traditional services that had suffered
funding cuts. The increased funding was intended for planning, design,
construction, maintenance and management of remediation devices. The proposal
to increase the CRR to 5% was adopted by Council on the 13th April 1997
and still applies today.
Approximately 50% of the CRR is directed to
non-capital costs including project management and a series of studies,
associated with meeting the SoJI objectives. These studies are designed to
identify more precisely the cause and effect mechanisms of pollution generation
in the Shire, develop effective longer term remedies for the problems, and
establish appropriate technological and monitoring techniques to determine and
report progress. The remaining 50% of
CRR funding is allocated to on-ground capital remediation works and subsequent
routine maintenance of all constructed devices. Current remedial environmental
protection works include the design and construction of wetlands, gross
pollutant devices or stormwater quality interception devices, leachate control
from old landfill sites, sediment basins and creek
stabilisation/rehabilitation.
The Catchments Remediation Rate
Expenditure Review Panel (the Panel) was established in July 1997 following
community consultation on increasing the CRR from 2% to 5%. The Panel meets
twice annually to review expenditure following the second and fourth quarters
of each financial year and currently comprises six community members, relevant
council staff and two nominated Councillor/s. The purpose of the Panel is to
ensure accountability and transparency of expenditure of CRR funds.
It should be noted that the
Hornsby Shire Local Environment Plan (LEP), 1994, permits Council to undertake
the construction or maintenance of stormwater drainage and water quality
treatment devices, bush regeneration and landscaping without obtaining
development consent. The proposals for construction are assessed under Part V
of the Environmental Planning and Assessment Act, 1979, which requires
Council to prepare a Review of Environmental Factors (REF). This identifies and evaluates the impacts of
an activity to determine whether the impacts are likely to significantly affect
the environment. The REF must also consider impacts of the activity on critical
habitat or threatened species, populations or ecological communities or their
habitat, under section 5A of the EP&A
Act.
The Threatened Species Conservation Act (TSC Act) 1995 specifies a set
of seven factors which must be considered by decision makers in assessing the
effect of a proposed activity on threatened species, populations or ecological
communities, or their habitats. These factors are collectively referred to as
the seven part test of significance.
The outcome of any
threatened species assessment should be that activities are undertaken in an
environmentally sensitive manner, and that appropriate measures are undertaken
to minimise adverse effects on threatened species, populations or ecological
communities, or their habitats. If the application of the seven part test finds
that a significant effect is likely then:
· A
Species Impact Statement must be prepared and the concurrence of the Director
General of the Department of Environment and Climate Change (DECC).
· The
activity may be modified such that a significant effect on threatened species,
populations or ecological communities, or their habitats is unlikely be sought.
Council is also required to notify and exhibit work proposals as per
Notification Protocol contained in Council’s Exempt and Complying Development
DCP (1999). This entire procedure has been quality assured under the NATA
certified ISO 9002 – Quality Management System and the ISO 14001 –
Environmental Management System, which the Water Catchments Team of Council
received in July 2000. These international standards will ensure that document
control, corrective and preventative actions and environmental procedures are
appropriately applied to all related projects.
1.4 Asset/
Lifecycle Management
Lifecycle
management enables Council to plan interventions, whether its maintenance or
renewal, at the optimum stage of an asset’s deterioration to enable cost
effective extensions of its useful life. There are a number of activities considered
in lifecycle management:
· Operations are those activities that have no effect on
asset condition but are necessary to keep the asset appropriately
utilised.
· Maintenance is the day to day work required to keep
assets operating at agreed service levels, and falls into two broad categories:
planned (proactive) maintenance is maintenance activities planned to prevent
asset deterioration; and unplanned (reactive) maintenance is maintenance
activities to correct asset malfunctions and failures on an as required basis
(e.g. emergency repairs). Maintenance
work is required to maintain the asset’s ability to provide the agreed service
level but does not extend the life of the asset. Operations and Maintenance expenditure are
considered an “Expense” for Council’s financial accounting purposes. A key
element of asset management planning is determining the most cost-effective mix
of planned maintenance in order to reduce unplanned maintenance to a minimum.
· Renewal work is the substantial replacement of the
asset, or a significant asset component, to its original size and
capacity. This work generally aims to
return the asset to a condition or state similar to the original asset.
· Replacements (or reconstruction) are those projects
that are created for the extension or upgrading of assets required to cater for
growth or to maintain or improve on the levels of service.
The
Stormwater Drainage Asset Management Plan (SDAMP) 2006 provides a financial
forecast for water quality assets in the Shire over a 20 year period. Cumulative
operating expenditure identified in the Plan, includes the cumulative
operation/maintenance expenditure and asset renewals and upgrades associated
with assets reaching their optimum life or age. To ensure
responsible financial management the assumptions made in the modelling were
very conservative. Hence, both renewal and projected maintenance cost were set
at a high level to allow for unforeseen circumstances or unpredictable rises in
costs.
The key feature of these financial projections is that
it is envisaged that in approximately ten years the opportunity for new capital
works across the Shire will steadily decline, resulting in a simultaneous
increase in operational and renewal costs. The life cycle analysis modelling of
catchment remediation program, as with Council’s Asset Management Plans, will
be reviewed at regular intervals to allow for the input of monitoring and
knowledge gained over time.
|
Hornsby Shire Council
|
Attachment to Report No. EN38/08 Page 8
|
2.0 Selection and implementation of the CRR Capital Works
The selection and implementation of structural
treatment measures involves six steps (Victoria Stormwater Committee, 1999).
These are:
1. Determine treatment objectives
2. Develop treatment train
3. Site identification
4. Short-list potential treatments
5. Compare potential treatments
6. Detailed design
Due to the varying degrees of expertise in different
fields the Environment and Works Division have forged a partnership approach to
deliver CRR capital works projects. Over the past 10 years, the Works Division’s
Design and Construction Branch has been able to incorporate the additional
design, construction and project management responsibilities associated with
CRR capital works into their annual civil works improvement program.
It is believed that there are a number of benefits
both to the Works and Environment Division and to the Council as a whole as a
result of this partnership. Some of
these are:
· Projects are developed ensuring compatibility with
local engineering and environment standards, and making sure that all issues
are addressed
· What is learnt from involvement in these projects is
utilised in all Council works so that we are setting the standards for
developers/builders to follow
· Opportunities for Works Division staff to be involved
in environmentally "cutting edge" technologies
· Involvement of staff in the Works Division in an area
of environmental management, with a flow-on effect resulting in better
understanding of sustainability issues
· Opportunities for Environment Division staff to become
more aware of engineering issues in the development of projects
· Potential expansion of the core business of the Works
Division.
The combination of the push towards competitive
tendering and the need to seek specialised engineering and contractor services
has also given management the impetus to consider contracting out or tendering
some of the design and construction activities. At present a small proportion
of the works is contracted out (usually low-risk remediation projects such as
stream remediation works and minor GPD’s) together with specialised design and
consulting services. As a result of this strategy, the Environment Division has
being satisfied at the quality of work achieved and the cost-benefit involved.
Included within the CRR capital works budget is
provision for monitoring and maintenance of all structures on a regular,
recorded basis. Due to the current strain on Council’s resources, the
increasing number of structures being built and the resulting demand for timely
and efficient maintenance, Council has continued to utilise contractors (on a 3
year contract) to undertake maintenance works under Council supervision.
Maintenance typically involves regular cleaning of
Gross Pollutant Devices (GPD’s) and periodic maintenance of sediment traps and
wetlands in terms of sediment removal, bank repair, weed control/spraying and
some general landscaping work. Fundamental design principles allow ease of
draining/flow bypass and access for maintenance of all water quality control
devices which results in efficient and cost-effective maintenance techniques in
the long term.
The existing contracts stipulate the contractor’s
responsibilities. These are outlined as follows:
· To maintain existing water quality remediation
structures to ensure optimal functioning and a weed-free surrounding landscape
· To ensure quality control/assurance throughout the
maintenance process incorporating:
o minimal
pollution of the site during cleaning and transport of materials
o efficient,
accurately documented records of contents removed and/or actions taken
o compliance
with Council’s environmental checklist
· The Contractor/s will be required to provide both a
status and cleanout report sheet for each structure after maintenance. Council
requires this to evaluate GPD performance, device accountability and
landscaping/bush regeneration costs per unit area
· The Contractor/s will be required to dispose of waste
material to a nominated landfill, or preferably a privately operated screening
recycling operation that offers a competitive rate per tonne (or compost onsite
in the case of vegetation). The only exception being the liquid/solid mix waste
removed by vacuum from wet sump devices such as the CDSâ, Humeceptor™ and Ecosol™ units. This waste shall be disposed of to an approved
location at Council’s expense
· That the Contractor/s has a proven record of
Occupational Health and Safety (OH&S) commitment, training and record
keeping.
The frequency of maintenance varies between treatment
measures. A majority of litter/gross pollutant devices need regular inspection
and maintenance after each significant rainfall event. In 2007/2008 Hornsby
Shire recorded approximately 50 large events (>10mm of rainfall in the
previous 48hrs) which resulted in higher than average yields (refer to Section
4.1).
Larger wet vault gross pollutant devices are inspected
and maintained on a quarterly basis, whilst constructed wetland and leachate
treatment systems are maintained on a more regular monthly schedule. Sediment
basins are inspected and maintained as required bi-annually. These basins need
periodic maintenance in terms of sediment removal, bank repair or minor
structural repairs. The scope of these works is based on additional quotations
for specific works, upon joint inspection by Council’s Superintendent and the
Contractor (see Table 2.0).
In 2004, Council engaged WBM Oceanics and Ecological
Engineering to prepare ‘Maintenance Guidelines for Stormwater Treatment
Measures’ under NSW Stormwater Trust funding. The resulting document provides a
detailed breakdown of maintenance procedures from planning and inspection
through to cleaning, disposal, monitoring and reporting.
Table 2.0 Maintenance Operations for
Stormwater Treatment Measures
|
Stormwater Treatment Measure
|
Inspection Frequency
|
Maintenance Frequency
|
Waste Destination
|
Reporting
|
|
GPD (end of pipe)
|
Storm event (>10mm in 48hrs)
|
Selective based on inspection
(within 5 working days)
|
Council material handling site.
Stockpiled for screening and reuse
|
Within 2 working days from
completion
|
|
GPD
(wet vault)
|
Quarterly (minimum)
|
Selective based on inspection
(within 5 working days)
|
Solids to Council material
handling site. Stockpiled for screening and reuse. Liquid fraction decanted
to passive open space.
|
Within 2 working days from
completion
|
|
GPD
(pit insert)
|
Monthly
|
Selective based on inspection
(within 5 working days)
|
Council material handling site.
Stockpiled for screening and reuse
|
Within 2 working days from
completion
|
|
Constructed wetland system or
Leachate treatment system
|
Monthly
|
Scheduled monthly
|
Weed material composted onsite.
Sediment tested for contaminants prior to disposal to landfill or reuse
|
Monthly
|
|
Sediment basin and Creek
remediation
|
Bi-annually or storm event
(depending on magnitude)
|
Selective based on inspection
(within 10 working days)
|
Weed material composted onsite.
Sediment tested for contaminants prior to disposal to landfill or reuse
|
Within 2 working days from
completion
|
All
contractors are required by Council to have an OH&S Policy in accordance
with the NSW OHS Act 2000 and OHS Regulation 2001 which aim to secure
and promote the health, safety and welfare of people at work. Employers and
supervisors of staff and contractors have a duty of care under the Act to
protect employees and demonstrate due diligence in their OHS Management
Systems. Council and contractor policies must address:
· certificates of currency for public liability and
professional indemnity insurance, third party
· motor vehicle insurance and workers compensation
· safe work practices and procedures (hazard
identification and risk analysis per site/device)
· induction and safety training (Green or White card)
· corrective action and documentation
· incident / accident recording and investigation
· personal protective equipment (PPE)
By ensuring
these requirements are met by both Council staff and contractors the risks
identified during the cleaning and maintenance process can be analysed,
evaluated and risk treatment plans implemented in accordance with AS/NZS 4360 Risk Management.
|
Hornsby Shire Council
|
Attachment to Report No. EN38/08 Page 11
|
The principal
objective of stormwater treatment measures is to improve the quality of
stormwater by removing pollutants, including litter, sediment, nutrients and
associated bacterial contamination. Stormwater structural treatment measures
can be grouped into three categories: primary, secondary and tertiary (Victoria
Stormwater Committee, 1999)
Table 3.0 Pollutant sizes and treatment
measure (Adapted from Engineers Australia, 2006)
|
Treatment Category
|
Treatment process
|
Typical
retained contaminants
|
Treatment measure
|
|
Primary
|
Physical screening or rapid sedimentation techniques
|
Gross pollutants and coarse sediment
|
GPT, sediment basins
|
|
Secondary
|
Finer particle sedimentation and filtration
techniques
|
Fine particles and attached pollutants
|
Sediment basins, Biofilters
|
|
Tertiary
|
Enhanced sedimentation and filtration, biological
uptake, adsorption onto sediment
|
Nutrients and heavy metals
|
Wetlands, Biofilters, Stormwater gardens
|
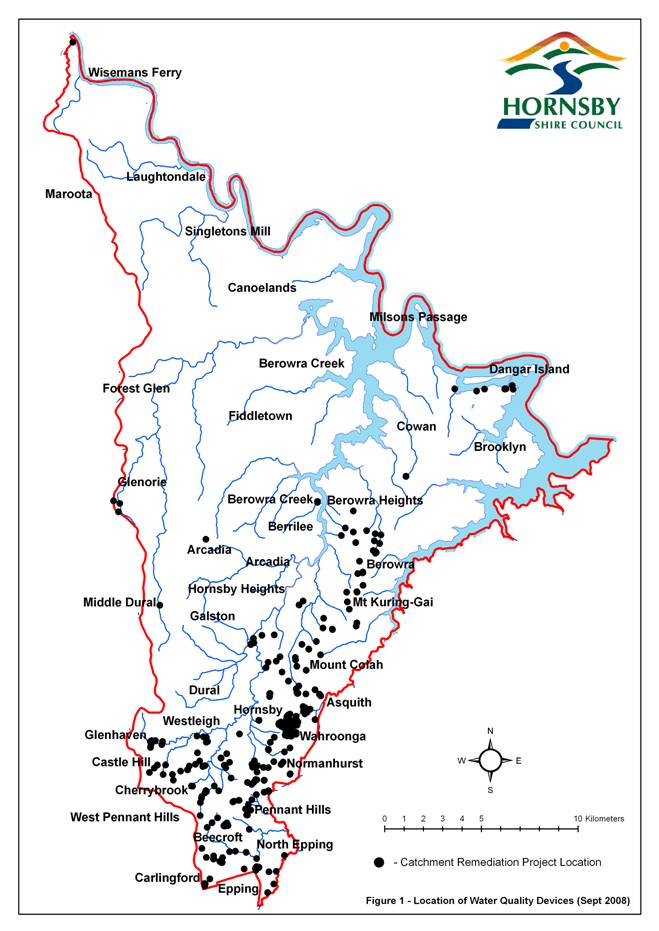
In 2007/2008,
16 catchment remediation rate capital works projects were completed at a total
cost of $957,000. These works involved the construction of 11 sediment basins,
four end-of-pipe gross pollutant traps, eight stream remediation projects, one
bioremediation basin and six stormwater gardens. These projects are detailed in combination
with previously constructed devices across Hornsby Shire (Locations mapped in
Figure 1) and are in bold for easy
differentiation.
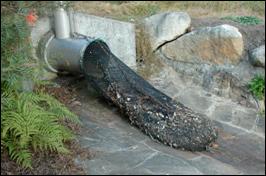
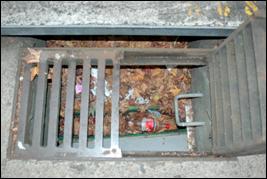
Gross
pollutants are typically those materials greater than 0.05mm, both degradable
and non-degradable, which detrimentally impact physically, visually and
bio-chemically on aquatic ecosystems. For the purposes of this report, a gross
pollutant device (GPD) can take many forms including traditional gross
pollutant traps with trash racks (refer to photo below), litter baskets, nets,
pit inserts and underground sumps. Some
GPD’s are fabricated to fit specific locations, whereas others are bought off
the shelf (proprietary devices). At
present over 370 GPD’s have been installed and constructed throughout the Shire.
3.1.1.
Trash Rack, Water
St, Hornsby
|
|
Trash Racks (21)
|
Norwood
Avenue,
Beecroft
|
 Clarinda Street,
Hornsby Clarinda Street,
Hornsby
|
|
Berkley Close, Berowra
|
Malsbury Road, Hornsby
|
|
The Gully
Road, Berowra
|
Old Berowra
Road, Hornsby
|
|
Warrina
Street, Berowra Heights
|
Hamley Road, Mt Kuring-gai
|
|
Belltree
Place, Castle
Hill
|
Denman Parade, Normanhurst
|
|
Woodgrove
Road,
Cherrybrook
|
Bellamy
Street,
Pennant Hills
|
|
Odney Close, Cherrybrook
|
The Comennara
Parkway, Thornleigh
|
|
Beecroft Road, Epping
|
Larool Cresent, Thornleigh
|
|
Tekopo Road, Glenorie
|
New Farm
Road, West Pennant Hills
|
|
Northcote
Road,
Hornsby
|
Wilga Street,
West
Pennant Hills
|
|
Water
Street, Hornsby
|
|

|
Mittabah Road, Asquith
|
Shepherds
and Macquarie Drives, Cherrybrook
|
|
Wattle
Street, Asquith
|
Clovelly Road, Hornsby
|
|
Sutherland Road, Beecroft
|
Burdett and
Sherbrook Roads, Hornsby
|
|
Bambil Road, Berowra
|
The Comenarra Parkway,
Thornleigh
|
|
Berowra Waters Road, Berowra
Heights
|
Janet Avenue, Thornleigh
|
|
Stratford Place, Asquith
|
Gleneagles Crescent, Hornsby
|
|
Baldwin Avenue, Asquith
|
Clarinda Road, Hornsby
|
|
Joalah Crescent, Berowra
|
Sherbrook
Road, Hornsby
|
|
Ti-tree
Close, Berowra
|
Binya Close, Hornsby
|
|
Childrey Place, Castle Hill
|
Raphael
Drive, Hornsby Heights
|
|
Kenburn Avenue, Cherrybrook
|
Pacific Highway, Hornsby
Park
|
|
Flametree
Close (West), Cherrybrook
|
Parklands
Road, Mount Colah
|
|
Flametree
Close (East) , Cherrybrook
|
Jessica Place, Mount
Colah
|
|
Pecan
Close, Cherrybrook
|
Pacific Highway, Mount
Kuringai
|
|
Glenoak Way, Cherrybrook
|
Pacific Highway, Mount
Kuringai
|
|
Alberta Avenue, Cowan
|
Hinemoa Avenue, Normanhurst
|
|
New Line Road, Dural
|
Brittania Street, Pennant Hills
|
|
Ridge
Street, Epping
|
Brittania Street, Pennant
Hills
|
|
Pembroke
& Stanley Road,
Epping
|
Blantyre Place, Thornleigh
|
|
Galston Road, Galston Gorge
|
Blantyre Place, Thornleigh
|
|
Burdett Street, Hornsby
|
Duneba Drive, Westleigh
|
|
Rosemead Road, Hornsby
|
Duneba Drive, Westleigh
|
Channel Nets, Burdett St, Hornsby
Nettech, Pacific Hwy,
Hornsby
|
|
|
Dudley Street, Asquith
|
Millbrook Place, Cherrybrook
|
|
Gardenia
Street, Asquith
|
Monterey Place, Cherrybrook
|
|
Jacinta Avenue, Beecroft
|
Rosemary Place, Cherrybrook
|
|
The Gully Road,
Berowra
|
End Lockyer Place,
Dural
|
|
Woodcourt Road, Berowra
Heights
|
Pike Road, Hornsby
Heights
|
|
Dusthole Bay, Berowra Waters
|
Hunter Street, Hornsby Mall
|
|
George Street, Brooklyn
|
Sefton Road (Council Depot), Thornleigh
|
|
Dangar Road, Brooklyn
|
Dartford Road (Road Reserve), Thornleigh
|
|
Foley Place, Castle Hill
|
Unwin Road, Waitara
|
|
Castle
Howard Road, Cheltenham
|
Boyd Avenue, West Pennant Hills
|
|
Anthony Street , Carlingford
|
George Street, Pennant Hills
|
|
Off Heights Place, Hornsby Heights
|
Old
Northern Road, Wisemans Ferry
|
|
Beecroft/Carlingford/Epping (35)
|
Pennant
Hills Commercial area, Pennant Hills (4)
|
|
Mills Park Tennis Carpark, Asquith
|
Thornleigh
Industrial/Commercial (11)
|
|
Wattle
Street, Asquith (3)
|
Thomas and
Orara Streets, Waitara (6)
|
|
Berowra Waters Road & Pacific
Hwy, Berowra (4)
|
 Eucalyptus Drive, Westleigh Eucalyptus Drive, Westleigh
|
|
Dusthole Bay, Berowra Waters
|
|
|
Brooklyn Road, Brooklyn (5)
|
|
|
Cairnes Road, Glenorie
|
|
|
Hornsby
Industrial area, Hornsby (20)
|
|
|
Dural
Street, Hornsby (3)
|
|
|
Hornsby CBD (70)
|
|
|
Pacific Highway, Mount
Colah
|
|
|
Sue Place, Mount
Colah (2)
|
|
|
Denman Road, Normanhurst (2)
|
|
Pit
Insert, Dural St, Hornsby
|
|
Natural wetlands are transitional environments between
terrestrial and aquatic habitats. They are characteristically shallow
environments that are cyclically, intermittently or permanently inundated by
fresh, brackish or saline water. Wetlands provide habitat for biota such as
emergent macrophytes, macroinvertebrates, amphibians, reptiles and birds which
are dependant on the inundation of the wetland.
In managing urban stormwater pollution of natural
waterways, constructed wetlands are often built to mimic nature and to achieve
improvements in stormwater quality through natural physical and chemical
processes. Furthermore, they provide additional benefits through the provision
of habitat for aquatic and terrestrial fauna, maximising biodiversity and
enhancing aesthetics.
To date, Council has constructed wetlands funded
through the Catchments Remediation Rate (CRR) at the following locations:
|
Lamorna
Avenue,
Beecroft
|
Clarinda
Street,
Hornsby
|
|
Midson Road, Beecroft
|
Clovelly Road, Hornsby
|
|
Plympton Road, Beecroft
|
Laurence
Street,
Pennant Hills
|
|
Brooklyn Road, Brooklyn
|
Dartford Road, Thornleigh
|
|
Hastings Park, Castle Hill
|
John Savage
Crescent, West Pennant Hills
|
|
Ridge Street, Epping
|
Boundary Road, West Pennant Hills (Wallameda)
|
|
Sallaway Road, Galston
|
|
Midson Rd Wetland, Beecroft
|
|
Hornsby Shire Council maintains
fifty-nine (59) sediment basins throughout the Shire which have either been
constructed under the Catchments Remediation Program.
Council
scheduled the cleaning of a number of established basins in 2007/2008. It is
important that sediment basins are cleaned at least bi-annually (or at 30%
capacity) so as to prevent colonisation of weeds and the release of potentially
bio-available contaminants caused by disturbance events (eg. scour and
re-suspension).
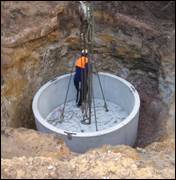
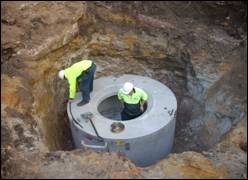
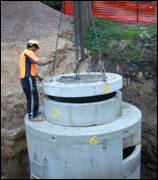
During 2007/2008, 11 new basins*
were constructed at:
|
Boundary Street, Berowra
|
Stewart
Avenue , Hornsby
|
|
Castle
Howard Road, Cheltenham
(x2)
|
Murralong
Road, Mount
Colah
|
|
Kirkham
Street, Cheltenham
(x2)
|
Nicholas
Crescent, Normanhurst
|
|
Alberta
Avenue, Cowan
|
Duneba
Drive Westleigh
|
|
James Henty
Park, Dural
|
|
*The ten new basins
were included in the 59 sediment basins that council currently maintains.
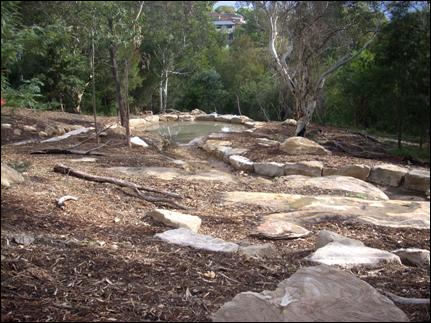
Newly constructed
sediment basin, Kirkham Street,
Cheltenham
|
|
Many creeks become physically degraded when the natural
hydrology of the catchment is altered. This most often results in creek bank
scour and erosion which is accelerated through processes such as the clearing
of riparian vegetation and increased stormwater runoff from impervious
surfaces. This degradation can have a detrimental impact on water quality often
resulting in an increase in sediment transport and associated sediment bound
contaminates.
Aquatic flora and fauna are impacted through a loss of
habitat, increased competition with weeds, poor light penetration into the
water column due to increased turbidity levels and smothering of benthic
organisms with increased sedimentation.
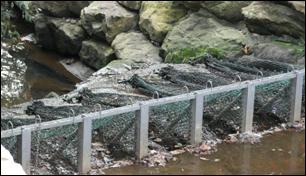
In the remediation of a degraded section of stream the
following techniques are used:
· Creek bank stabilisation -
Typically using locally sourced
sandstone boulders that prevent the creek bank from eroding any further, and
provide habitat for fauna and flora on the rock surface and in cracks between
rocks. A variety of softer creek bank armouring strategies are also incorporated,
including the pinning or staking of jute mesh/matting, woven blankets, fallen
logs and chain-wire mesh. These approaches are often combined with native plant
cells or tubestock.
· Meanders - To aid in the reduction of flow velocities during
storms.
· Riffle zones and natural
rock fall structures - Are used to
provide in-stream habitat, stabilise the creek bed, aerate the water and allow
maximum UV light treatment from sunlight to destroy faecal bacteria.
· Pool zones - Are incorporated to create habitat for fauna and
macrophytes and to dissipate flow velocities which allows sediments to drop out
for later removal.
· Revegetation of riparian
zone - This zone is planted with
indigenous native tubestock to improve habitat, enhance faunal corridors and
vegetation links, provide a food source for both terrestrial and aquatic
organisms and to stabilise the banks.
· Stabilising stormwater outlets - Rock armouring around stormwater outlets reduces
erosion and scour caused by high flows.
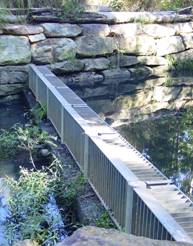
Sites that have undergone stream remediation since
implementation of the Catchments Remediation Program have been summarised in
Table 3.1. In 2007/2008, eight (8) new sites
underwent creek remediation works in the suburbs of Cheltenham, Berowra,
Normanhurst, Westleigh, Hornsby and Mount
Colah and are highlighted
in bold.
|
|
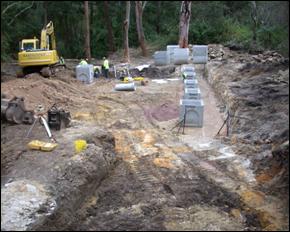
Creek
remediation works, Duneba
Drive, Westleigh
|
|
Table 3.1 Stream
Remediation Projects in the Hornsby Shire
|
Berowra Creek
Catchment
|
Lane Cove River Catchment
|
|
|
|
|
Berowra – Boundary
Street
|
Beecroft – Fearnley Park
|
|
Castle Hill –
Hastings Park
|
Beecroft – Lamorna Avenue
|
|
Cherrybrook –
Woodgrove Road
|
Beecroft – Midson Road
|
|
Hornsby – Clarinda Street
|
Beecroft – Norwood Avenue
|
|
Hornsby –
Reddy Park
|
Beecroft – Plympton Road
|
|
Hornsby – Stewart
Avenue
|
Beecroft –
Ray Park
|
|
Hornsby Heights – Heights Place
|
Carlingford – Anthony
Street
|
|
Mount Colah – Murralong
Road
|
Cheltenham – Castle Howard Road
|
|
Mount Colah –
Parklands Road
|
Cheltenham – Kirkham Street
|
|
Pennant Hills
– Laurence Street
|
Epping – Kent Street
|
|
West Pennant
Hills – John Savage Crescent
|
Epping – Ridge Street
(west)
|
|
West Pennant Hills – Wilga Street
|
Normanhurst –
Hinemoa Avenue
|
|
Westleigh – Duneba
Drive
|
Normanhurst – Nicholas
Crescent
|
|
Westleigh – Eloura
Road
|
Pennant Hills
– Orchard Street
|
|
|
Thornleigh –
The Comenarra Parkway
|
|
Cowan Catchment
|
Epping – Ridge Street (east)
|
|
Hornsby Ck – Sherbrook
Road
|
Epping – Pembroke Road
|
|
|
Epping – Stanley Street
|
|
Hawkesbury River Catchment
|
Cherrybrook – Flametree Crescent
|
|
Brooklyn – Brooklyn Road
|
|
In addition, the majority of gross pollutant devices
discussed in this report also incorporate some stream remediation to stabilise
banks around the devices and improve habitat immediately up and downstream.
Although the environmental benefit of stream
remediation works is difficult to quantify, the works provide a significant
benefit in terms of a reduction in erosion and associated sediment loads moving
to the lower reaches of the creeklines and receiving waters, improved native
riparian and aquatic habitat and enhanced visual aesthetics.
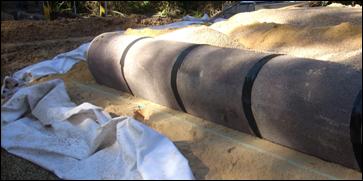
3.6 Bioremediation Basin
- Castle Howard Road,
Cheltenham
In March 2008, Council began work on a bioremediation
system in Cheltenham to treat urban stormwater
to a tertiary level. The system encapsulates the “treatment train” approach by
combining the use of a GPD, porous piping and bioremediation basin.
 Gross pollutant device: To ensure optimal performance and prevent clogging
of the system a CDSâ Unit has
been installed. This unit uses vortex forces to remove larger refuse and
sediment, which is stored in an offline sump, before delivering stormwater to
the bioretention basin.
Gross pollutant device: To ensure optimal performance and prevent clogging
of the system a CDSâ Unit has
been installed. This unit uses vortex forces to remove larger refuse and
sediment, which is stored in an offline sump, before delivering stormwater to
the bioretention basin.
 Porous piping:
After leaving the CDS unit, stormwater (free of gross pollutants) is directed
into specially designed porous concrete pipes. Stormwater exfiltrates (leaks)
through the permeable walls of the pipe into the surrounding substrate filter
media. During this process mechanical filtration takes place. Furthermore,
biofilms develop within the porous pipes system which assists by digesting
pollutants, such as organics and nutrients.
Porous piping:
After leaving the CDS unit, stormwater (free of gross pollutants) is directed
into specially designed porous concrete pipes. Stormwater exfiltrates (leaks)
through the permeable walls of the pipe into the surrounding substrate filter
media. During this process mechanical filtration takes place. Furthermore,
biofilms develop within the porous pipes system which assists by digesting
pollutants, such as organics and nutrients.

Bioremediation
basin: When the exfiltration capacity
of the pipes is reached (that is, water is coming in faster than it leaks out)
then the stormwater will surcharge (back–up) into the basin itself and
percolate vertically down through the vegetation and filter media. 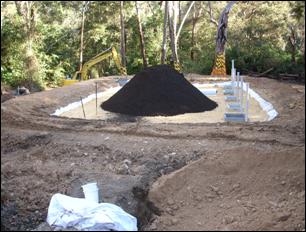
 Both the vegetation type and filter media (loamy sand)
have been specified to comply with the latest findings from current research to
maximise the treatment performance of the bioremediation basin. While the concept is simple thousand of hours
of research, both nationally and internationally, have gone into determining
the most favourable specifications.
Both the vegetation type and filter media (loamy sand)
have been specified to comply with the latest findings from current research to
maximise the treatment performance of the bioremediation basin. While the concept is simple thousand of hours
of research, both nationally and internationally, have gone into determining
the most favourable specifications.
High flow
by-pass: The system also has a high
flow diversion channel installed to redirect high stormwater flows that may
damage or erode the filter media and vegetation from the system.
As this is the first system of this specific design configuration
to be constructed in Hornsby Shire Council it is planned to undertake sampling
up and downstream of the basin to determine its effectiveness at reducing
pollutant concentrations. This will be done using automated samplers that
provide the ability to sample stormwater from rain events before and after
stormwater has passed through. Results from this sampling program will be used
to determine whether similar systems will be installed elsewhere throughout the
Shire. They will also add to a growing
database of work being done nationally on the development of best practise
stormwater quality management. Furthermore, the site will be used as a demonstration
site to educate other local governments and the general community in the
benefits of bioremediation in treating stormwater.
3.7 Stormwater Gardens - Turner
Road, Berowra
In June 2008, Council completed the installation of
six stormwater gardens on Turner Road,
Berowra. These systems (also known as
biofilters or bioremediation systems) have been demonstrated to be effective at-source
structural stormwater pollution control measures (Fletcher et al 2005).
Stormwater flows over the vegetated area and slowly
percolates through the filter media. Pollutant removal is achieved though the
interface of the vegetation and filter media as a result of enhanced
sedimentation in the vegetation zone, mechanical filtration, sorption and other
chemical processes in the filter media and plant and biofilm uptake of
pollutants (Hatt et al 2006). An underdrain collects the treated water and
delivers it to existing stormwater infrastructure.
|
|
|
|
|
|
 |
|
|
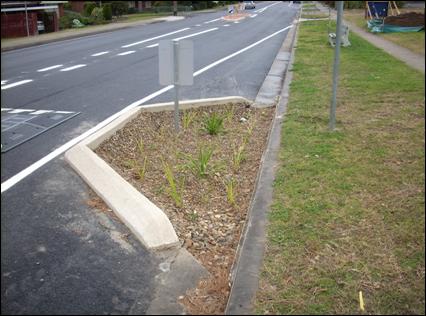
One of the
six stormwater gardens installed on Turner Road, Berowra (Illustration reproduced courtesy of Brisbane City Council)
|
|
Hornsby Shire Council currently requires developments
greater than 2500 square metres in area to provide permanent stormwater quality
treatment devices on or adjoining their subject sites. Developers are
conditioned by Council to also provide maintenance during the construction
phase in accordance with an approved Asset Maintenance Plan. Following
completion of the development, two scenarios can result:
1. Developer
Constructed, Council Maintained
These devices were installed by Developers as a
condition of development consent (usually Torrens Title) and have been taken
over by Council to maintain after which 80% of the lots have had dwellings
erected and occupied. Council will usually seek a financial contribution from
the developer towards operating and life cycle costs.
2. Developer
Constructed, Community Association Maintained
These devices have also been installed by Developers
as a condition of development consent and either, continue to be maintained by
developers in the short term or are the responsibility of the body corporate to
maintain under Community or Strata Title.
Council currently keeps a record of these stormwater
quality assets in order to ensure all maintenance complies with the consent
conditions post-occupation. Council usually reaches a mutual agreement with developers
to take over the basins as Council assets, in return for a sum of money which
has been estimated to sustain the maintenance of basins over a 20 year life
cycle.
Listed below are sites where developer built wetlands
and sedimentation basins required have been constructed as a condition of
development consent. It should be noted that only the Shepherds Drive,
Cherrybrook and Sydney Road,
Hornsby Heights constructed wetlands are
currently under the care, control and management of Council. The remaining
wetlands are managed by Community Associations or developers under approved
Plans of Maintenance.
|
Summer Hill
Way,
Berowra
|
The Outlook, Hornsby Heights
|
|
Foley Place, Castle Hill
|
Kalang Road, Mount
Colah
|
|
Shepherds Drive, Cherrybrook (The Lakes)
|
Huntingdale
Way,
Thornleigh
|
|
Millstream Grove, Dural
|
Wild Ash
Avenue, Thornleigh
|
|
Sydney Road, Hornsby
Heights
|
The Sanctuary, Westleigh
|
|
Hornsby Shire Council
|
Attachment to Report No. EN38/08 Page 22
|
Daily
rainfall data is obtained from the Bureau of Meteorology at nine sites across
the Shire. This data is used to examine the relationships between total yields
of gross pollutants and rainfall. In 2007/2008 the Hornsby Council area
recorded above average annual rainfall and was subject to a high proportion of
large rainfall events (Refer to Appendix A for statistical data). This explains
the comparative increase in yields referred to in following section.
The collection of performance data
over the 2007/2008 financial year has allowed Council to examine the indicative
maintenance costs and gross pollutant removal trends for the 370+ water quality
improvement devices in the LGA. The results indicate that in 2007/2008 the
gross pollutant devices have served to remove approximately 1236 cubic metres
of sediment, litter and organic matter from the Shire’s waterways. These volumes were large and can be best
explained by two anomalies:
1. The
above average rainfall that resulted in greater volumes of pollutants being
mobilised and captured (refer to figure 4.3); and
2. The
higher than normal sediment and organic yield resulting from the cleaning out
of a number of sediment basins and the dredging of the Lakes of Cherrybrook
(150m3). As a result, sediment volumes accounted for approximately
48% of the total pollutant load captured, litter 5% and organic matter 47%.
The following
series of figures examine the performance of GPD’s in 2007/2008 and against
previous years.
Figure 4.1: The relationship between average monthly volume of gross pollutants
and average monthly rainfall.

When pollutant volume is analysed against average
annual rainfall all three categories of gross pollutants are mobilised and
captured after only 10 mm of rainfall, evident on the graph by the steep rise
in the curve. This phenomenon is referred to as the “first flush” effect, after
which the volume captured continues to rise at a much slower rate in relation
to rainfall volumes.
It can be seen that the load of litter recovered from
all devices over the period is fairly consistent for all size rainfall events
(indicated by the flat dotted line). This is most likely due to the fact that
litter is readily mobile and floatable in the formal drainage system (curb,
gutter and pipes) and most of it will be flushed and collected in downstream
GPD’s, even in small rain events. However, the fact that the curve for sediment
is steadily climbing, proportional to rainfall, illustrates that after the
initial flush the transport of sediment is directly proportional to stormwater
volumes and associated energy.
Figure 4.2:
Volumes of pollutants removed from GPD’s (2007-2008)
The actual volume of pollutants removed from month to
month varied greatly in the 2007-2008 period. A clear correlation between
monthly removal rates and rainfall cannot be made due to: 1) variable lag times
between rainfall events and cleaning events, and 2) the disproportionally high
volumes removed from sediment basins and wetlands which are in addition to
regular cleaning events.
However,
a strong correlation is found between rainfall and pollutant yield from Council’s
GPD’s when viewed annually, as shown in Figure 4.3. With increased rainfall there is increased
stormwater run-off into Council’s drainage system that results in pollutants
being mobilised, transported and trapped by GPD’s.
Figure 4.3:
Pollutant volume removed from GPD's against average annual rainfall over the
last three years
Figure 4.4 Prediction of annual gross pollutant rates using
landuse area.
Hornsby Shire Council is now at a stage
where the data gathered from the various gross pollutant devices can be used to
predict the annual gross pollutant (export) rates on the basis of landuse.
Figure 4.4 shows how the annual export rate of pollutants exponentially
increases with the amount of catchment that is urbanised (excludes
bushland/open space). This information can be used when planning for future
devices, in terms of expected export rates and known device capabilities.
Stormwater managers can then compare actual pollutant export rates with the
predicted values in order to gauge the efficiencies of devices through time.
The high frequency of Hornsby Council’s inspection and
cleaning of the devices combined with the unique trap designs for ease of
maintenance, ensures that the pollutant trapping efficiency is optimum for each
storm event and that materials do not decompose or stagnate causing additional
problems with the release of pollutants into the water column.
The
total cost to Council to maintain its water quality assets and adjacent
landscaped areas was approximately $347,000 in the 2007/2008 financial year ($257,000
for cleaning/maintenance, $90,000 for landscaping/vegetation maintenance). This
cost included device inspections, cleaning and desilting, material processing
for reuse, disposal of litter to landfill, asset maintenance and repair,
landscape maintenance and weed control in and around assets and maintenance of
leachate treatment and reuse facilities. However, the higher than expected
costs were as a result of two one-off maintenance projects:
· Remediation
of Mt Colah stockpiling site: $87,000 (Refer to section 4.4 for further
detail);
· Dredging
of Lakes of Cherrybrook: $45,000
Table 4.0 presents the averages in terms
of capital investment and operational cost for individual basket, trash rack
and proprietary devices from the period June 2001-June 2008. The average annual
installation and maintenance cost per hectare of catchment for proprietary
traps is still quite high in comparison to the traditional trash racks and
baskets. However, the proprietary devices average annual capture per hectare
offsets these higher costs by being superior to the traditional devices, mainly
as a result of their closer proximity to the pollutant source.
Table 4.0
GPD Comparative Costs from July 2001 - June 2008
|
Device
|
Average Clean Cost $
|
Average Annual Maintenance Costs $/yr *
|
|
Trash Rack (n=21)
|
200
|
1,466
|
|
Large Trash Basket (n=10)
|
92
|
631
|
|
Proprietary Device (n=58)
|
143
|
2079
|
|
Pit inserts
(n=170)
|
17
|
203
|
In March
2008, as part of the CRR maintenance program, Council initiated dredging works
at the Lakes of Cherrybrook. This activity involved the removal of depositional
material (organic matter and sediment) from the upper and lower ponds.
Contractors dredged the lower pond using a walking excavator and trucks. Sediment plumes on both the tributaries to
the upper pond were removed in a less invasive manner through the use of
eduction trucks.
The
dredging works form part of an overall water quality and ecological improvement
initiative for the lakes embarked upon under the CRR program in 2008. Other
components of the initiative proposed in 2008/2009 include:
· Installation
of aerators in both ponds to increase dissolved oxygen levels, enhance water
quality and hopefully reduce the prevalence and severity of Botulism outbreaks.
· Deployment
of rafted reedbeds in the lower pond, which act as floating wetlands and
provide high levels of water quality treatment.
·  Planting of native aquatic
plants at the interface between water and land to enhance water treatment,
stabilise banks and provide habitat.
Planting of native aquatic
plants at the interface between water and land to enhance water treatment,
stabilise banks and provide habitat.
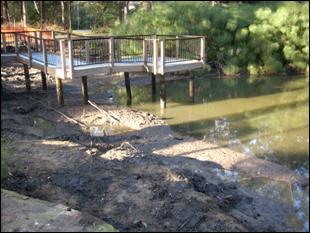
Contractors
removing dredge spoil, Lakes of Cherrybrook Lower pond after
dredging, Lakes of Cherrybrook
|
|
A summary of wetland related annual costs and
monitoring data is contained in Table 4.2. The average maintenance cost for
Council’s major wetlands is calculated at $3,035 per site per year (or 1.6% of
the average capital cost).
The size of catchments draining to these constructed
wetlands ranges from 15-400 hectares. The average pond surface area to
catchment area ratio calculates at 0.23% which is below the minimum design size
recommended by DLWC (1998) of 2% of the catchment area. It should be noted that
this recommendation does not account for the variability associated with
different catchment land uses, pollutant loads, peak flows, topography and
soils. It is best used to determine preliminary wetland feasibility. Because
the nature of Hornsby Shire is so topographically constrained (ridge top
development that does not afford large areas for wetland construction) and
contains significant remnant bushland, the wetland feasibility threshold is
much lower than average.
Water
quality monitoring of five separate systems managed by council over the past 10
years has shown that levels of total nitrogen, phosphorus, suspended solids and
faecal coliforms are significantly reduced under base flow and small storm flow
events. Monitoring results are based on both grab and load-based samples (and
multi-probe analytes) obtained by Council over multiple rainfall events and
inter-events.
Two
wetland sites were monitored during 2007-2008 period (Refer to the Water
Quality Annual Report 2007/2008 fro statistical analysis). Sampling was not
undertaken during large stormflow events. Clarinda Wetland was removing on
average approximately 40% of Total Nitrogen and Oxidised Nitrogen, 50% Ammonium
Nitrogen, 60% Faecal Bacteria and 30% Suspended Solids. Cherrybrook Lakes
was found to be removing approximately 60% Total Nitrogen, Ammonium Nitrogen
and Oxidised Nitrogen, 40% Phosphorus and 70% Faecal Coliforms. However, there
was an average increase of Suspended Solids from 5 to 6.8 mg/L., probably
resulting from an increase of algae and organic debris in the open water bodies
and a nett decrease in dissolved oxygen in water flowing out of both wetlands,
indicating oxygen was taken up by microbial and vegetative materials in the
deeper still waters.
Table 4.2 Constructed
Wetland annual costs and monitoring records to date.
|
Wetland
|
Capital Cost $ (Year)
|
Pond Surface Area
(m2)
|
Pond Surface Area to Catchment Area (%)
|
Cost per m2 of pond
($/m2)*
|
Average Annual Maint. Cost2
($/yr)
|
Monitoring Data
(year/s)
|
|
Laurence St, Pennant Hills
|
135,000 (1996)
|
225
|
0.06
|
619
|
4,227
|
June 1995 – June 2002
|
|
Boundary
Rd, West Pennant Hills
|
288,000 (1996)
|
1875
|
0.14
|
158
|
7,7613
|
August 1998 –
June 2002
|
|
Plympton Rd, Beecroft
|
305,000 (2000)
|
350
|
0.06
|
875
|
1,187
|
November 99 – June 2002
|
|
Brooklyn Rd, Brooklyn
|
46,000 (1997)
|
205
|
0.26
|
231
|
1,3043
|
Nil
|
|
Clovelly Rd, Hornsby
|
117,000 (1999)
|
210
|
0.02
|
561
|
819
|
Nil
|
|
Sallaway Rd, Galston
|
36,000 (2000)
|
190
|
0.01
|
193
|
664
|
Nil
|
|
Clarinda St, Hornsby
|
241,000 (2001)
|
1550
|
0.82
|
160
|
6,2273
|
July 2002 – current
|
|
Hastings Park, Castle Hill
|
445,000 (2002)
|
1500
|
0.60
|
300
|
5,054
|
July 2001 –
August 2003
grab & load
|
|
Midson
Rd, Beecroft
|
252,000 (2003)
|
1220
|
0.03
|
208
|
2,1213
|
Nil
|
|
John Savage Cres, West Pennant Hills
|
203,000 (2004)
|
1050
|
0.09
|
194
|
1,0733
|
Nil
|
|
Lamorna Ave, Beecroft
|
134,0004
(2005)
|
400
|
0.44
|
347
|
4,946
|
Nil
|
|
Dartford Rd, Thornleigh
|
80,000
(2006)
|
250
|
2.27
|
324
|
1036
|
Nil
|
|
Mean
|
190,000
|
752
|
0.4
|
348
|
3035
|
NA
|
|
1 Includes monthly grab sampling (wet/dry) and probe (total of 13
parameters). Analysis by NATA lab
2 Includes weeding/spraying, sediment/rubbish/debris removal,
planting/mulching and replacement and reporting (excludes volunteer Bushcare
labour)
3 Volunteer Bushcare present onsite
4 Capital costs incorporates up to 100m of stream remediation
*Cost/m2 of
pond is calculated using capital cost and average annual cost/year
|
The CRR
maintenance program aims to reduce the quantity and cost of disposing of
recovered material to landfill by reuse and recycling within the LGA. This
activity has been undertaken by Council for a number of years and is seen as
being ecologically and financially sustainable.
However,
due to the increasing volumes that were being removed from GPD’s in 2007/2008,
due to above rainfalls the amount of material that needed to be stored and
mechanically sorted was becoming too large to be accommodated at the designated
site in Mt Colah. Therefore, the decision was made in early 2008 to cease this
activity until a more suitable site could be sourced and established. The Mt
Colah site was cleared of all residual material and remediated at a cost of
$87,000.
Until a
future site is found, Council will incur ongoing disposal costs for GPD
material in excess of $120,000 per annum based on extraction and disposal
volumes from the previous two years. This cost is up to 80% more than is
required when we are able to sort and reuse the material within the LGA.
Furthermore, the material is now being exported to landfill sites outside of
the Shire. This position is neither ecologically or financially sustainable,
therefore Council staff will be pursuing all avenues to source a suitable site
for material sorting and stockpiling.
5.0 LANDSCAPE MAINTENANCE
AND BUSH REGENERATION
Due to the increasing number of devices being built
and the resulting demand for timely and efficient maintenance, Council has
continued to engage bush regeneration contractors on a 3 year basis. The
contracts are annually renewed based on a performance evaluation of the
previous year’s work and compliance with the conditions of the contract.
The key objectives of the contract are:
i) to maintain planted native vegetation around water
quality structures and nominated wetlands, using methods that have minimal
environmental impact on aquatic organisms and water quality;
ii) treatment and eradication of any riparian and
aquatic weeds giving priority to the treatment of categorised noxious weeds,
applying herbicide according to manufacturers specifications and in a
responsible and recorded manner (in terms of both environmental and personal
safety); and
iii) to provide a maintenance report for each site
after treatment, including a more detailed maintenance report for the wetland
sites which is required to assess the extent of plant growth and site recovery
from weed infestation.
In 2007/2008, contractors were responsible
for landscape maintenance around eighty plus sites at a cost of $57,690 (1825
hours). This involved weeding and spot spraying of the immediate area
surrounding each water quality control asset including landscaped areas that
have been mulched and planted with local native species. Some replacement
planting and staking of existing tubestock is also required. Newly constructed
devices will also require planting of terrestrial tubestock and in some cases,
aquatic (macrophyte) plantings, with all plant stock being supplied by Council’s
nursery. Maintenance reports and invoices are submitted to Council on a
fortnightly basis. Targeted terrestrial weed species include - Privet, Camphor
Laurel, Lantana, Blackberry, Turkey Rhubarb, Castor Oil plant, Balloon Vine,
Madeira Vine, Honeysuckle, Morning Glory, Asparagus Fern, Mist Flower, Crofton
Weed, Ochna, Ginger, Wandering Jew and other herbaceous weeds and grasses such
as Kikuyu and Paspalum.
This involves the maintenance weeding/spraying of
riparian areas and removal of weeds and nuisance plants within the shallow
wetland ponds. In 2007/2008, contractors were
responsible for maintaining 14 wetland sites at a cost of $33,000 (this
includes four wetlands not built using funding from the CRR budget). Of this
$33,000, 80% was dedicated to Councils four largest wetlands (Wallumeda, Laurence Street, Hastings
Road and Clarinda Street).
Time is also allocated to the removal of stormwater litter/rubbish strewn
throughout the pond and edge areas. Replacement planting with macrophytes is
also carried out, including occasional wetland establishment at new sites. A
wetland maintenance sheet is required to be completed when conducting works
within wetlands, as Council requires this information for wetland condition
monitoring.
Target aquatic weed species include Typha
(Bullrush), Barnyard Grass, Milfoil, Watercress, Cyperus eragrostis and other undesirable or noxious water plants
(e.g. Ludwidgia (peruviana), Alligator Weed and Salvinia). If a W1 Noxious Weed
category plant is found onsite, the Contractor is to immediately notify Council
as required under the Noxious Weeds Act
1993.
|
|
John Savage Wetland,
West Pennant Hills: Contractors planting aquatic plants
|
|
|
Hornsby Shire Council
|
Attachment to Report No. EN38/08 Page 31
|
The Catchments Remediation Program has also been
responsible for funding the treatment of polluted leachate from two of the
Shire’s largest former municipal tip sites at Arcadia
Park, Arcadia and Foxglove Oval, Mt Colah. Instead of using the traditional technologies
available for the treatment of leachate, Council has looked to more sustainable
and innovative methods that can achieve pollution reductions and serve as a
model for leachate treatment at a local government, state and national level.
This work is significant by
way of the methodology which mimics natural processes of nitrification and
denitrification. Council staff have worked together in a trans-disciplinary
manner, together with specialised scientific consultants to design, construct
and monitor both treatment systems. Council is committed to the long-term
maintenance, monitoring and management of the two facilities in order to
justify and apply the technological benefits to other landfills within the
Shire. Monitoring to date has revealed a dramatic reduction in ammonia which
has maximised the opportunities for reuse on adjoining open space and
landscapes.
Foxglove waste disposal site was in operation from
1963 to 1980. This site produces approximately 10,000L/d of leachate due to the
location of the tip on an existing drainage line, and the lack of a sound
impervious capping layer over the oval. The main environmental concern within
the leachate is the elevated ammonia concentrations ranging between 40 and 200
mg/L.
Stage 1 of the rehabilitation process has been
completed, which involved capturing the leachate using a leachate cut off
drain, collection well, pump and soakage pit at the base of the landfill. The collected leachate is then pumped to a two-cell (vertical and
horizontal flow), soil-based reed bed (shallow wetland) which significantly
improves the quality of leachate leaving the fill. This treated leachate is
then pumped to and irrigated (below ground drip) over the adjoining native
woodlots and park. Costing around $300,000 to install, the system is able to
treat around 10,000 L/day of ammonia rich leachate and has minimal ongoing
costs. It has been calculated that the system saves Council about $40,000 p.a.
(in lieu of waste water disposal costs).
The final stage of the leachate remediation was
completed in Febuary 2008 and has involved the installation of a bio-reactor to
treat 4,500-6,000L of leachate a day to a level compatible with standards for
irrigation reuse. Developed and patented by Biospot P/L, the bio-reactor technology uses a process whereby Nitrosomonas and Nitrobacter
are immobilised on a carrier (that is, bacteria able to process nitrogen
compounds are placed in a tank “reactor” where they attach to plastic beads).
The reactor design offers “Simultaneous Nitrification (that is conversion of
ammonia to nitrite and nitrate) and Denitrification” (that is conversion of
nitrate and nitrite to nitrogen). The design of the reactor optimises the
production of nitrate and removal of ammonia from over 50mg/L to below 2mg/L. The treated water from the reactor then passes
through the reed beds where it is “polished” to a quality suitable for irrigation
on the adjoining sportfield.
Monitoring results illustrating the high level of
treatment achieved by the system can be viewed in the “Annual Water Quality
Report 2007/2008”.
Leachate bioreactor and control panel,
Foxglove Oval, Mt Colah.
|
|
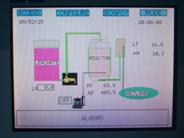
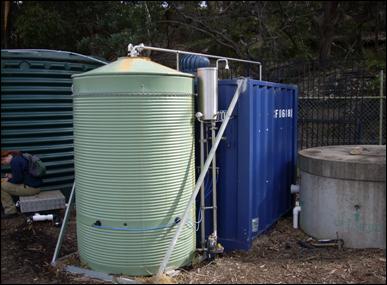
6.2 Arcadia Park, Arcadia
In 1997/98 the Arcadia landfill was
remediated by capping the fill with clay and separating the stormwater and
leachate collection systems. Stage 1
works involved the relocating of waste from adjacent properties, regrading the
landfill to reduce batter slopes, separation of leachate and stormwater into
separate collection systems, clay capping of the landfill surface and
stabilisation/revegetation of these surfaces.
At present two concrete
tanks at the base of the site collect around 60,000 litres of ammonium rich
leachate every quarter. Council uses the same technology deployed at Mt Colah
to treat approximately1000 L/day of leachate at the site. Costing less than $40,000, the payback period for the
treatment system was calculated at 3 years based on savings associated with
previous waste water disposal costs.
|
Hornsby Shire Council
|
Attachment to Report No. EN38/08 Page 33
|
Since 1997, the Catchments Remediation Rate (CRR) has
funded a proportion Council’s Street Sweeping Program at a total cost of
$226,000 per year. Street sweeping is an effective method by which gross
pollutants (sediment, leaves and litter) can be collected at source by
targeting problem leaf drop areas and high pollutant load land use areas, e.g.
commercial and industrial.
In 2007/08, 2184 tonnes of material was collected from
scheduled cleaning of roadside curb and guttering, with on average 110 km of
road being swept per week. The majority of the material is leaf and bark
(organic matter) resulting from high leaf drop during dry weather.
Figure
7.1 compares volumes extracted by GPD’s against street sweeping. Interestingly,
in the case of street sweeping, rainfall can be observed to have an inversely
proportional relationship, that is, street sweeping volumes increase the lower
the rainfall. In simplistic terms this can be attributed to a combination of
the high leaf drop during dry weather and material being available to be
removed by street sweeping due to less frequent run-off events.
Figure 7.1:
Comparison of volume of pollutants extracted by GPD's and street sweeping
against average annual rainfall
*
Average Annual Rainfall calculated from rain gauges with complete annual
records only.
The two Schartz A5600XL vacuum sweepers which were
purchased in 2002 have had their sides labelled with environmental messages and
acknowledgement of the CRR funding.
This activity remains a viable way to collect larger
gross pollutants at source and hence prevent material and associated
contaminants from entering the drainage system and waterways under stormwater
flow.
|
Hornsby Shire Council
|
Attachment to Report No. EN38/08 Page 34
|
This report has aimed to provide quantitative data and
analysis of the relative performance of different water quality control
measures, including gross pollutant devices, sediment basins, wetlands and
bioremediation systems that have been constructed to improve stormwater quality
in Hornsby Shire. The results of the report can be used by stormwater and
catchment managers to provide a better insight into determining the type of
structure and suitability for specific sites. Furthermore, the data provides
valuable information about the costs (both capital and maintenance), benefits
and device optimisation which can aid in the formulation of strategies to
improve catchment/landuse practices by both structural and non-structural
means.
Overall, the findings of this report should give
stormwater managers a better insight into the cost-effectiveness and
performance of water quality improvement structures and the management of
life-cycle costs for individual stormwater quality assets. The performance of
these devices has allowed Council to both refine and modify future designs, and
judge their appropriateness to proposed remediation sites based on catchment
size and land use impacts.
Brisbane City Council (2006). Water
Sensitive Urban Design – Technical Design Guidelines for South East Queensland.
Version 1 released June 2006.
Collins, A. (2005). Stormwater Reuse Issues and Experiences –
Hornsby Shire Council. Stormwater
Industry Association 2005 Regional Conference, Port Macquarie,
NSW, 20-22 April (12pp).
Cooperative Research Centre for Catchment Hydrology
(2003). Model for Urban Stormwater
Improvement Conceptualisation (MUSIC). Version 2 released December 2003.
DLWC (1998). The Constructed Wetlands Manual – Volumes
1&2.
EPA (1999). Environmental Guidelines: Assessment,
Classification and Management of Liquid and Non-Liquid Wastes.
Engineers Australia (2006) Australian Runoff Quality Engineers
Media
Hatt, B et al (2006) Filter media for stormwater treatment and
recycling: the influence of hydraulic properties of flow on pollutant removal
Water, Science and Technology IWA Publishing
Hornsby Shire Council
(1997). Catchments Remediation Program
Five Year Plan (Revised Edition). Report prepared by The Water Catchments
Team.
Hornsby Shire Council
(2002). Catchments Remediation Capital
Works Annual Performance Report 2001/2002. Prepared by The Water Catchments
Team, October 2002.
Hornsby Shire Council
(2005). Annual Water Quality Monitoring Report 2006/2007. Prepared by The
Water Catchments Branch, October 2007.
Hornsby Shire Council
(2006). Draft Stormwater Drainage Asset Management Plan. Prepared by the Water Catchments and Assets
Branches, May 2006.
Microclimate (2006) Annual Progress Report for major CRR
Wetlands. July 2006.
Rocla CDSâ Technologies Pty Ltd, Gross Pollutant Traps Product Brochure, November
2007.
University of Technology, Sydney (2004). Environmental Assessment of HydroCon Stormwater Infiltration Systems at
Hornsby. Faculty of Engineering.
Victoria Stormwater Committee (1999). Urban Stormwater: Best practise
environmental management. CSIRO
WBM Oceanics (2005). Maintenance Guidelines for Stormwater Treatment Measures. Final
Report January 2005. Prepared for Hornsby Shire Council under NSW Stormwater
Trust funding.
Location and Sources of Rainfall Data (BOM 2008)
|
Monthly/Annual Rainfall For Hornsby Shire (mm)
|
|
Location and
BOM Station No.s
|
W. Pennant Hills
67089
|
Berowra
67052
|
Carlingford
66185
|
Mt Kuring-gai
61119
|
Maroota
567063
|
Dural
67086
|
Glenorie
67010
|
Brooklyn
66008
|
Pennant Hill
66047
|
Wisemans Ferry
61119
|
Monthly Average
|
|
Jul
|
36
|
28
|
37
|
22
|
30
|
37
|
24
|
34
|
41
|
20
|
31
|
|
Aug
|
140
|
169
|
152
|
129
|
149
|
120
|
108
|
140
|
141
|
139
|
139
|
|
Sep
|
38
|
9
|
37
|
32
|
38
|
30
|
33
|
51
|
39
|
25
|
33
|
|
Oct
|
20
|
129
|
39
|
69
|
10
|
18
|
18
|
40
|
36
|
7
|
38
|
|
Nov
|
155
|
168
|
198
|
140
|
121
|
155
|
145
|
158
|
172
|
154
|
157
|
|
Dec
|
142
|
70
|
220
|
145
|
204
|
192
|
199
|
232
|
221
|
163
|
179
|
|
Jan
|
89
|
182
|
80
|
100
|
#
|
86
|
91
|
109
|
92
|
163
|
110
|
|
Feb
|
245
|
156
|
249
|
168
|
#
|
265
|
187
|
221
|
267
|
196
|
217
|
|
Mar
|
80
|
31
|
64
|
83
|
#
|
52
|
72
|
72
|
81
|
39
|
64
|
|
Apr
|
99
|
115
|
115
|
#
|
#
|
108
|
74
|
198
|
142
|
156
|
126
|
|
May
|
3
|
121
|
121
|
#
|
#
|
8
|
27
|
7
|
5
|
0
|
36
|
|
Jun
|
133
|
#
|
27
|
#
|
#
|
134
|
138
|
161
|
165
|
107
|
124
|
|
TOTAL
|
1179
|
1205
|
1338
|
886
|
550
|
1204
|
1116
|
1423
|
1402
|
1169
|
NA
|
#
Missing data (average does not take missing data into account)
Average rainfall and average number of days exceeding 10mm and 50mm of
rain for 6 sites across the Shire 2007/2008. (Note: Figures in brackets are for
2006/2007)
|
Month
|
Average
Monthly Rainfall (mm)
|
Average No. of Days >10mm rain
|
Average No. of Days >50mm rain
|
|
Jul
|
31
|
2 (0)
|
0 (0)
|
|
Aug
|
139
|
2 (4)
|
2 (0)
|
|
Sep
|
33
|
1 (1)
|
1 (1)
|
|
Oct
|
38
|
1 (5)
|
0 (0)
|
|
Nov
|
157
|
7 (0)
|
1 (0)
|
|
Dec
|
179
|
7 (1)
|
2 (0)
|
|
Jan
|
110
|
4 (1)
|
0 (0)
|
|
Feb
|
217
|
8 (4)
|
1 (0)
|
|
Mar
|
64
|
2 (5)
|
1 (1)
|
|
Apr
|
126
|
5 (4)
|
1 (0)
|
|
May
|
36
|
4 (1)
|
0 (0)
|
|
Jun
|
124
|
6 (9)
|
3 (2)
|
|
Total
|
1253
|
50 (35)
|
13 (4)
|
# Missing data (average does not
take missing data into account).